What are the Market Implications of Aggressive Bitcoin Purchases by Individual Investors?
2022-12-26 04:15:25While average investors have been collecting coins throughout 2022, Bitcoin (BTC) whales have been rapidly liquidating their holdings.
Retail traders are those who own one bitcoin or fewer, whereas bitcoin whales are those who own more than 1,000. Previous analysis by CryptoSlate showed that during 2018, the number of retail investors' Bitcoin holdings increased from 1.5 million to 3 million. In contrast, whales' BTC holdings have dropped from about 10 million to 9 million throughout the same time period.

Divergent opinions among market analysts exist over what this signifies for Bitcoin. However, most people concur that whale sales often indicate a negative trend for the price of BTC.
The majority of the time, these holders' activities have a significant impact on the price. Due to the fact the whales have the greatest supply, their dumping increases the amount of food that is accessible and reveals a drop in their conviction, which may cause others to change their opinions.
An additional benefit of this is a more evenly distributed Bitcoin network. BTC is less susceptible to the activities of whale investors when more individuals own it. This arrangement, according to Maartunn, is ideal, but obtaining it could take some time.
Seth Michael Steele, a different analyst, said:
"Whales are selling, but the public is purchasing! Although it seems paradoxical, this will benefit investors by increasing distribution. It's lovely to see Bitcoin shrimp picking up the slack for whales! The latest accumulations and sell-offs may indicate that Bitcoin is approaching the bottom of the current negative market cycle. The bottom is typically close when tiny entities are more active in accumulation than small ones.
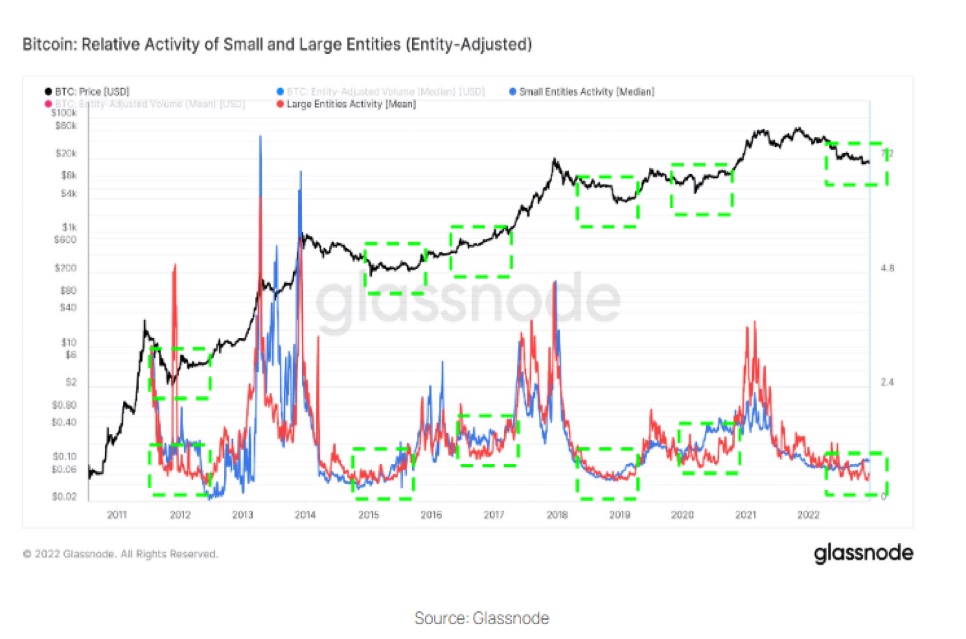
When retail activity outpaces whale activity, according to CryptoSlate's research of Glassnode's relative activity of small and big businesses since 2012, the market bottoms. The accompanying graphic shows that this occurred in 2012, 2015, 2017, 2019, and 2020.
The market bottom was signaled in each of the situations highlighted by increasing activity from individual investors; the graphic demonstrates that this trend has started to replicate itself in 2022.
Disclaimer: The information provided in this section doesn't represent any investment advice or FAMEEX's official position.