Weekly Analysis of the Cryptocurrency Market (April 10-April 11)
2023-04-12 09:31:40
1. Market Trend
Between April 10 and April 11, the BTC price fluctuated between $27,876 and $30,430, with a volatility of 9.16%. According to the 1-hour candle chart, the BTC price has stayed above the weekly chart (MA168) and has reached a new high in the past 9 months, implying a strong bullish signal.

Source: BTCUSDT | Binance Spot
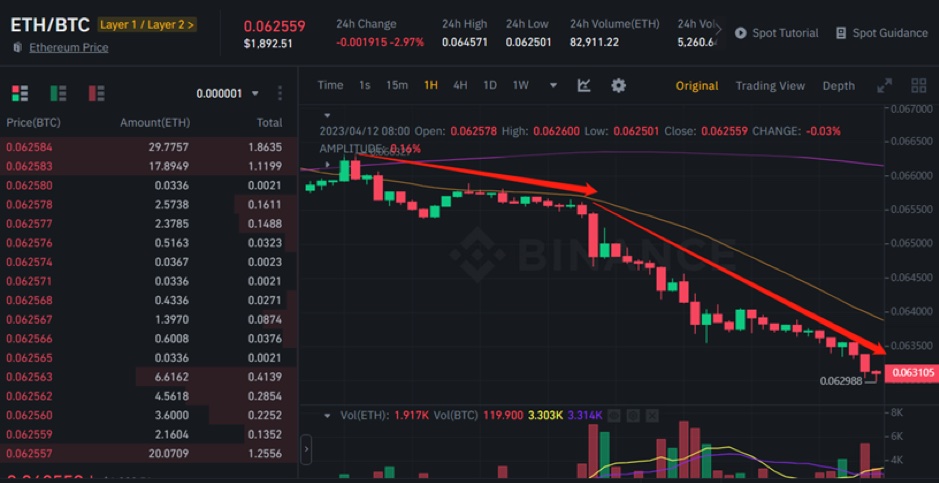
From the perspective of the ETH/BTC trend, the price of ETH/BTC fell by 4.64% from April 10 to April 11. As to the 1-hour candle chart, the price of ETH/BTC, running below the daily chart, continued to decline, indicating that BTC is leading the short-term trend while altcoins have not yet entered the buoyant phase.

Overall, the market remains strong with BTC’s breakthrough followed by the price increase of altcoins. It is expected that there will be a significant market trend within the next three months. Based on current prices, the overall market may surge 40% to 60%.
2. Industry Roundup
1) On April 10, OpenAI, Microsoft, Google, Apple, Nvidia and others held a meeting to discuss standards for AI development and usage.
2) On April 11, BTC surpassed $30,000, a new high since June 2022.
3) On April 11, Douyin, China’s version of TikTok, supported data queries for the Bitcoin price ticker.
4) On April 11, the Hong Kong Web3.0 Association was established, with Hong Kong Chief Executive John Lee Ka-chiu in attendance and giving a speech.
Disclaimer: FameEX makes no representations on the accuracy or suitability of any official statements made by the exchange regarding the data in this area or any related financial advice.