Consolidation of The Bitcoin Range Paves The Way For Significant Altcoins
2024-01-29 07:29:05Bitcoin is currently navigating the $38,000 to $49,000 range, creating a potential upward movement for SOL and AVAX.

Source: money.usnews.com
Over the weekend, Bitcoin displayed gradual upward movement, suggesting sustained interest from bullish investors. Recent data from Bloomberg analyst James Seyffart, dated January 26, indicates that BlackRock's iShares Bitcoin Trust (IBIT) has surpassed $2 billion in assets under management.
While robust buying at lower levels has halted Bitcoin's decline, an immediate commencement of a new bull market seems unlikely. Bitcoin might undergo a consolidation of gains as attention shifts to inflows into recently launched Bitcoin exchange-traded funds and anticipation builds for the Bitcoin halving scheduled for April. A consolidation phase for Bitcoin would be seen positively, signaling that traders are not rushing to take profits, anticipating a continued upward trend.
This scenario could also bode well for specific altcoins, attracting investor interest and resuming their upward trajectory. Bitcoin's recovery has positively influenced certain altcoins. Let's examine the charts of the top 5 cryptocurrencies that have the potential for outperformance in the near term.
Analysis of The Price of Bitcoin
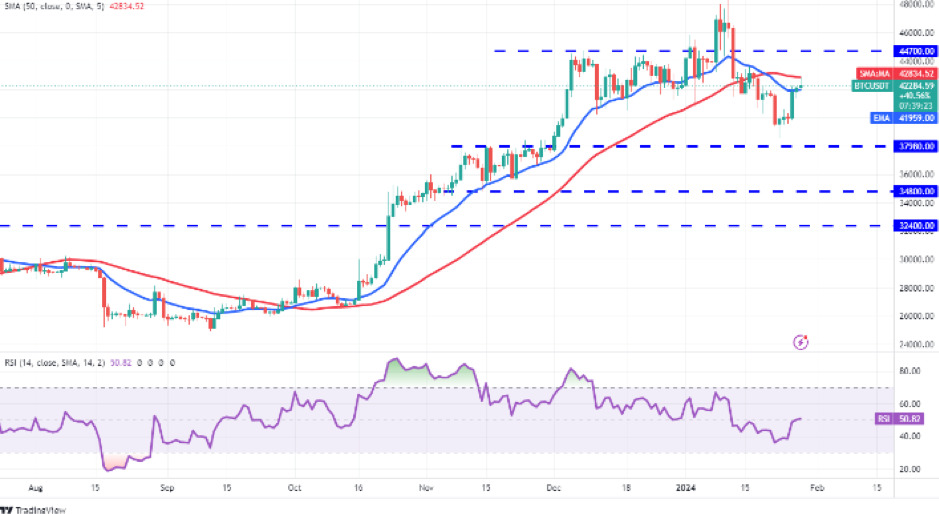
Bitcoin's positive momentum was evident on January 27 as it surpassed the 20-day exponential moving average ($41,959), signaling reduced selling pressure. The BTC/USDT pair is anticipated to fluctuate between $44,700 and $37,980. A break above $44,700 could signal buyer dominance, targeting $48,970, while a drop below $37,980 may lead to a correction towards $34,800.

BTC/USDT daily graph. Source: TradingView
On the 4-hour chart, a bullish crossover of moving averages and the RSI nearing the overbought zone suggest renewed bullish momentum. The rally may aim for $43,500 and $44,700. Downside support from moving averages is expected, and a breach below the 50-simple moving average could favor bears, potentially leading to a decline to $39,500 and further down to $37,980.
Solana Pricing Evaluation
Solana made a move above the moving averages on January 27 and is making efforts to sustain above the downtrend line on January 28. The 20-day EMA ($93) has leveled off, and the RSI is slightly above the midpoint, indicating a balance between buyers and sellers. A continued presence above the downtrend line may prompt the SOL/USDT pair to initiate a rally towards $107 and then $117.

SOL/USDT daily graph. Source: TradingView
To thwart an upward move, bears need to swiftly push the price below the moving averages. This could lead to trapping aggressive bulls and potentially result in a retest of support at $79.
Assessment of Avalanche Prices
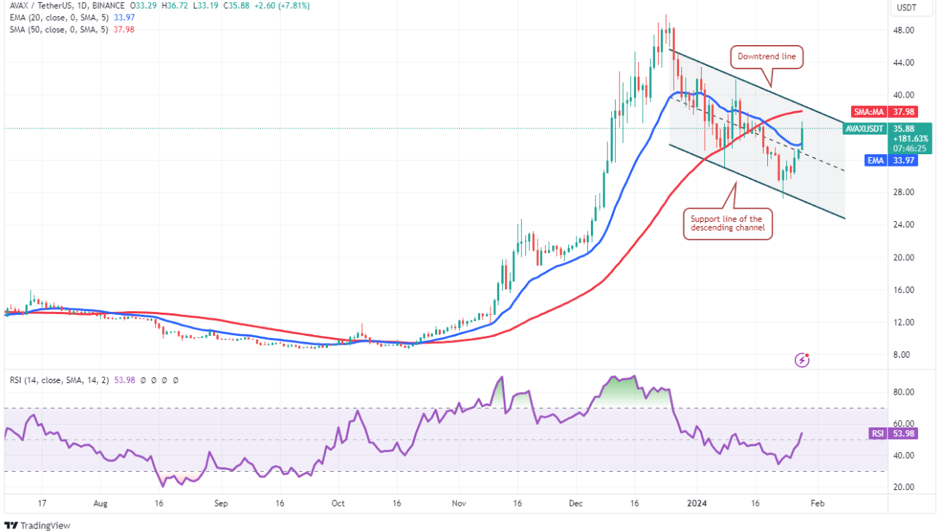
Avalanche is currently within a descending channel pattern. Buyers stepped in on Jan. 23, pushing the price above the 20-day EMA ($34) on Jan. 28. If the price reverses at the downtrend line, it indicates ongoing bearish pressure, and the AVAX/USDT pair may stay within the channel.

AVAX/USDT daily graph. Source: TradingView
On the flip side, a breakout above the overhead resistance could lead to a rally to $44 and, subsequently, $50. If the price bounces off the downtrend line, staying above the 20-EMA, it suggests traders view dips as buying opportunities, improving the chances of a breakout above the channel. Conversely, a downturn below the moving averages would suggest intense selling by bears, potentially keeping the pair within the channel.
Disclaimer: FameEX makes no representations on the accuracy or suitability of any official statements made by the exchange regarding the data in this area or any related financial advice.